 Alghadeer TV Alghadeer TV
The largest cryptocurrency fell as much as 4.9 percent Thursday to $46,322.
Bitcoin’s burst above the $50,000 level didn’t last long, and chart patterns signal its rally since July is at risk of fading.
The largest cryptocurrency fell as much as 4.9% Thursday to $46,322, with other tokens including Ether retreating along with the Bloomberg Galaxy Crypto Index. The drop pared Bitcoin’s rally from a July 20 low to about 60%.
Bitcoin was trading at $47,342 as of 10:10 a.m. in New York.
John Bollinger, inventor of Bollinger bands, in a tweet suggested taking some profits or hedging. Katie Stockton at Fairlead Strategies cited DeMark market-timing indicators as flagging about two weeks of “sideways-to-lower” prices.
Two charts help sum up the current situation for Bitcoin.
Shrinking Bandwidth
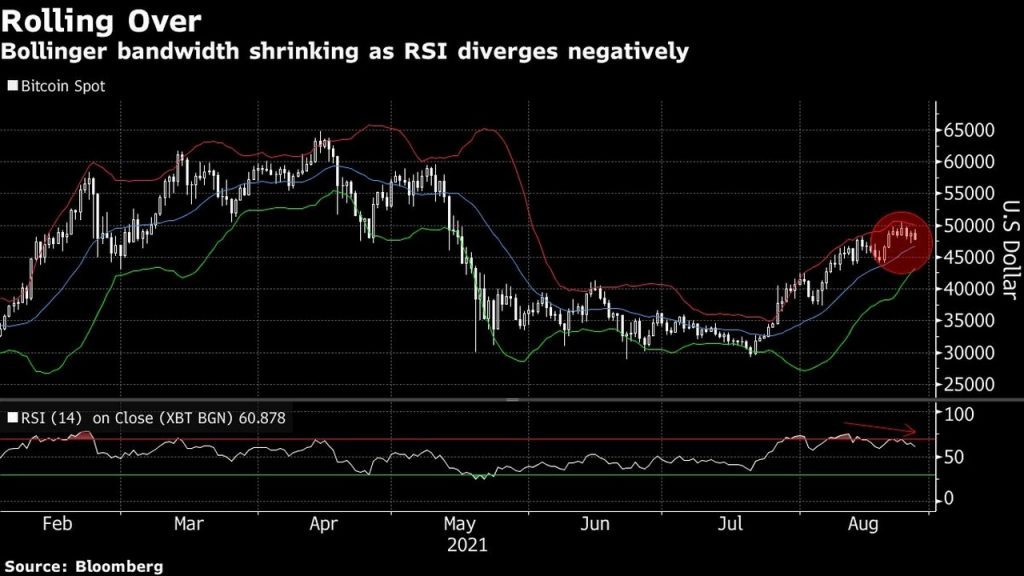
Narrowing Bollinger bands — a popular technical indicator that highlights volatility — — indicate the Bitcoin rally is flagging and that the virtual currency faces a zone of resistance from $50,000 to $51,000. A key threshold to watch is the middle line of the Bollinger study at about $46,700.
Time to pay attention: $BTCUSD Watch carefully, maybe take some profits or hedge a bit… Aggressive traders can think about putting out some shorts. Hodlers can look can look at add at lower levels if we see them. No confirmation yet, just be on the alert. #Bitcoin
— John Bollinger (@bbands) August 24, 2021
Point and Figure
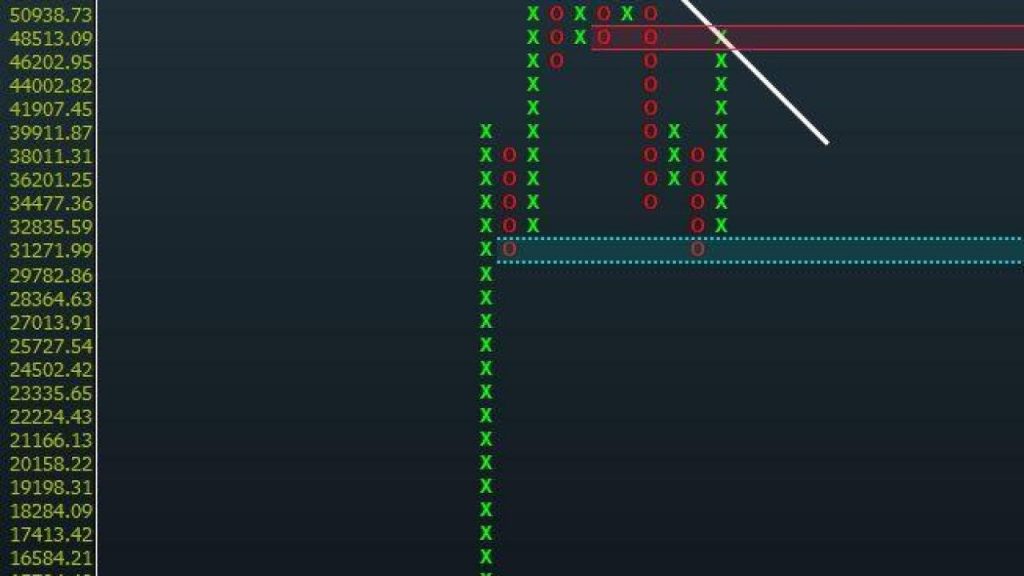
A so-called point and figure analysis — which spotlights the direction of prices without a time dimension — signals Bitcoin faces a challenge to scale levels around $50,940 on a closing basis. A failure to breach the 45-degree trend-line of the point and figure chart could strengthen the bearish case.